
WRITTEN BY SENSCHIRP READER- KarlssonFan
Earlier in the year, we looked at the Norris race using some stats such as Corsi as well as more traditional methods. Today, we’re going even more in depth. I’ve compiled a list of 21 defensemen that a) had exceptional seasons, b) are regarded by the media as “elite”, or c) I just stuck in for fun/comparison because they’re underrated. I’m also introducing new stats, as well as variations on ones we’ve already seen.
Here’s the list of players, divided by group:
-Karlsson, Doughty, Burns, Letang, Klingberg, Ekman-Larsson, Hedman
-Weber, Josi, Giordano, Subban, Suter, Byfuglien, McDonagh, Keith, Pietrangelo
-Brodie, Muzzin, Gardiner, Ellis, Lindholm
[EDIT: in an oversight of criminal proportions, I left out John Carlson, Marc-Edouard Vlasic, and Anton Stralman (and probably others). I don’t think they would be at the top of the rankings, but they are nevertheless borderline-elite defensemen in the league today. If I ever do another defensemen analysis, I’ll be sure to add them. Also, if I forgot any other great defensemen, please let me know in the comment section!]
First, an introduction to the stats we’re going to look at today. I tried to get a mix of offensive, defensive, and overall stats, as well as many (but not exclusively) rate and relative stats for better comparison. Without further ado, let’s dive in:
Corsi-For per 60 minutes of 5v5 play, Relative to Teammates (CF/60-Rel):
CF/60-Rel measures how many shot attempts team A directs at the opposing net with player X on the ice, relative to how many shot attempts team A directs at the opposing net without player X on the ice. Positive numbers indicate player X generates offense at a greater rate than his team. We use 5v5 play because that’s most indicative of skill level. We use per 60 minutes to account for variations in ice time. We use relative to teammates because certain teams generate more or fewer shot attempts based on systems, coaches, etc. This accounts for team variation.
Your leaders: Klingberg, Hedman, Burns, Karlsson, Byfuglien
Not too many surprises here, except perhaps Hedman at #2.
Corsi-Against per 60 minutes of 5v5 play, Relative to Teammates (CA/60-Rel):
Essentially the same as CF/60-Rel, but the opposite: how many shot attempts team A allows with player X on the ice vs. not on the ice. Negative numbers indicate player X suppresses shots at a greater rate than his team.
Your leaders: Lindholm, Doughty, Karlsson, Ekman-Larsson, Ellis
I’d say there are a lot of surprises here. Lindholm #1? Who saw that coming? And who the hell is Ellis? (for the record, he’s the defenseman that in an earlier post I suggested we acquire from Nashville along with Colin “11 points in 11 playoff games” Wilson.)
Corsi-Against per 60 minutes of short-handed play (CA-SH/60):
Essentially the same as CA/60-Rel, but for short-handed play (and not relative). How much does player X limit shots against when short-handed? I also chose to make this one of the non-relative stats, because I felt that the game play for short-handed play was more or less universal: don’t let the opposing team shoot the puck. Penalty-killing specialists and low sample-sizes skew relative results, too. Note: I set the minimum TOI for the season at 50 minutes, which excluded Klingberg and Gardiner. I felt their sample sizes were too small to be even close to valid.
Your leaders: Ellis, Ekman-Larsson, Karlsson, Subban, Byfuglien.
If anyone says they saw that coming, you’re a liar. Okay, those are the 3 shot-attempt-based metrics I looked at. Next we’ll look at point-production:
Points scored per 60 minutes of 5v5 play (P/60):
Basically: how efficient is player X at generating points at even strength?
Your leaders: Karlsson, Burns, Brodie, Hedman, Byfuglien.
Seems to make sense…except wait, is that noted offensive superstar T.J. Brodie in 3rd?
Points (P):
The most self-explanatory stat. Why are we looking at this, though? Well, sometimes regular counting numbers are useful. I also didn’t want to include power-play production, because some players (Karlsson, Burns, Subban) get waaaay more PP time than others (Ellis, Lindholm, Brodie). Straight points includes PPP, and rewards players for having more TOI as well, which the rate metrics don’t.
Your leaders: Karlsson, Burns, Letang, Josi, Klingberg.
Not surprising, everyone can check nhl.com/stats.
Individual Points Percentage (IPP):
“But…Dallas scored so many goals! Klingberg has an advantage!”. This is a good argument against using points as a measure. Luckily, we have fancy stuff like IPP to control for this. IPP measures the percentage of goals scored with player X on the ice that player X has a point on. Basically, how much is player X involved in goal scoring plays for his team while he is on the ice?
Your leaders: Karlsson, Burns, Josi, Letang, Brodie
This knocks Klingberg out of the top 5, and rewards other players who don’t have as many points but factor in on a huge percentage of their team’s goals when they’re on the ice (Brodie, Hedman, Pietrangelo). Alright, now we’re moving on to fun new stuff: Scoring Chances
Percentage of High-Danger Scoring Chances For at 5v5 play, Relative to Teammates (HD-SCF%-Rel):
Wow, that one’s a mouthful. Basically, how many high-danger (in the “home plate” area of the offensive zone) scoring chances does team A get and allow with player X on the ice vs. not on the ice? High-danger scoring chances have the highest chance of resulting in goals (hence “high-danger”). So, naturally, generating and suppressing them is very, very good. As an aside, high-danger save percentage is a good metric to evaluate goalie talent.
Your leaders: Lindholm, Ekman-Larsson, Ellis, Suter, Hedman
And finally, at stat #7, Karlsson is not in the top 5. On the other hand, here we have Lindholm and Ellis again…
Percentage of Scoring Chances For at 5v5 play, Leading (SCF%-Lead):
Alright, here we have a “protecting the lead” stat for those “shut-down” D. Well, actually, I lied. Shut-down D do terribly at this, just like every other stat except hits and blocked shots. This measures the ability to generate and suppress all scoring chances while playing with the lead. Basically, who do you want on the ice when you’re protecting a lead? Remember: getting hemmed in your own zone and blocking a billion shots is NOT the way to protect a lead. Shooting at your opponent’s net, however…
Your leaders: Hedman, Suter, Klingberg, Ellis, Keith
And the famed Duncan Keith makes a top-5 appearance! Also, wow, Hedman seems to be here a lot…and is that Ellis again?! And, finally, the last one for the day:
Percentage of Goals For, Relative to Teammates:
How many goals are scored and allowed when player X is on the ice vs. not on the ice? This had an absurd amount of variation, for whatever reason. Klingberg came in 1st at +17.2, and Pietrangelo brought up the rear at -5.6.
Your leaders: Klingberg, Ekman-Larsson, Subban, Byfuglien, Karlsson
I don’t know if these results are surprising or not, to be honest…these players all score a lot, so I guess it makes sense? They also probably get more PP time than SH time, so this is another stat that rewards PPP, since I don’t have that as a category.
Okay, so, how did I score this stuff? Basically, for each category, I took the top score out of these 21 players, and gave that a score of 2. Then everyone else was scored relative to that.
Here’s an example:
CF/60-Rel:
Take 2 and divide it by the top score, in this case Klingberg’s 11.89:
2/11.89= 0.168…
Then multiply that number by everyone else’s score: Hedman’s 11.2 x 0.168…= 1.88
All relative numbers CAN end up with negative scores. I then took total overall scores, offensive stat scores, and defensive stat scores.
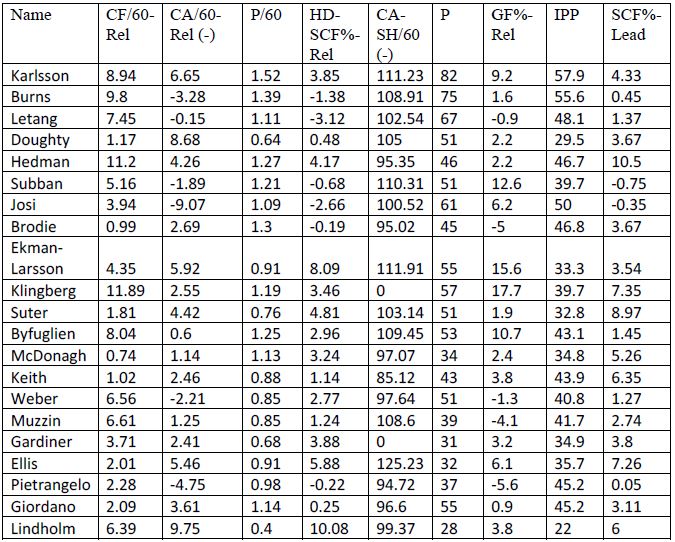
Here’s a ridiculously complicated table with actual stats, not scores out of 2 (for CA scores, marked with (-), I inversed the negatives, so bigger positive numbers are GOOD):
Now, here’s a table with summed scores for offensive (CF/60-Rel, P/60, P, IPP), defensive (CA/60-Rel, CA-SH/60, SCF%-Lead), and overall stats (offensive+defensive+HD-SCF%-Rel+GF%-Rel):
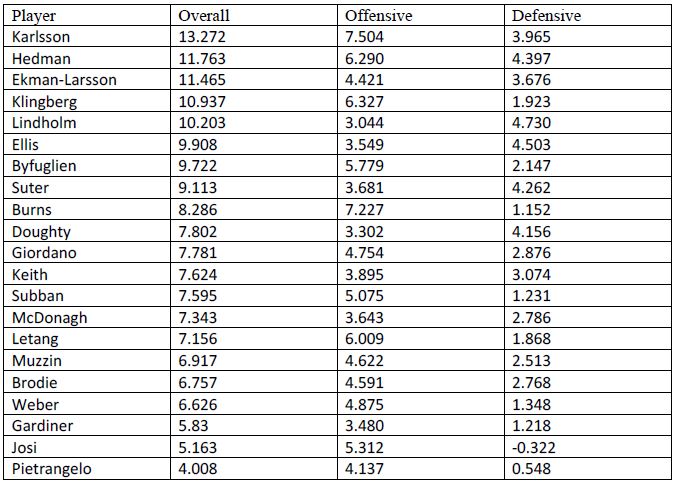
Now, you’re probably looking at that table and saying “there’s no way Hedman should be 2nd in Norris voting” or “how the %#$& are Lindholm and Ellis 5 and 6?!”, or maybe “Sweden currently has the best blue line perhaps in the history of hockey, and they are all 26 or younger”.
I do have some reservations about this statistical analysis. First, I don’t know if the system I used has the correct number of offensive, defensive, and overall statistics (you can see that there are more offensive than defensive stats, for example). Second, there are lots of stats that are not used here, the addition of which might change the overall rankings.
Overall, I have to say I am very surprised by these results. I knew Lindholm and Ellis were underrated, but I did not expect their defensive and overall numbers to be so insanely, ridiculously good.
Some interesting points:
-Lindholm overcomes his last-place offensive scores to end up 5th overall on the strength of his #1-ranked defensive stats.
-Josi and Pietrangelo, hailed as “elite” defensemen by many, got obliterated on defensive stats.
-Of the protypical “offensive D-men” (Karlsson, Klingberg, Subban, Burns, Letang), Karlsson blows the rest out of the water defensively. In fact, defensively he places 6th overall out of the 21 defensemen examined here.
-Hedman is so, so, so underrated. He’s up there with the elite of the elite.
The actual rankings need to be taken with a grain of salt, of course. Like I said, the stats I picked don’t tell us everything about everything, but I think they give a good variety of information that can be used to effectively judge the players. Perhaps Hedman isn’t the 2nd-best defenseman in the league, but the fact that he ranks 4th offensively and 3rd defensively in my rankings isn’t just a fluke. Also, Lindholm and Ellis are probably not the 5th– and 6th-best defensemen in the league, but their super-elite defensive stats aren’t just fabricated out of thin air. They are the new era of “shutdown” defensemen, in the sense that they suppress shots and get the puck up the ice. They are perfect partners for players like Karlsson, Klingberg, etc. They don’t push players off the puck as much as Weber and Doughty, but they suppress shots and scoring chances like nobody’s business.
So looking at this list, here are my big takeaways
-Everyone from Sweden is underrated. They must be doing something right in their “modern puck-moving defenseman development” program. Ellis and Byfuglien are also underrated.
-Weber, Doughty, Keith, Pietrangelo, Josi are overrated.
-Karlsson is the best defenseman in the world and deserves the Norris. Doughty can wait another 10 years for his “lifetime achievement award”.
-It’s time for the NHL community to realize that the big bruising “shutdown D” is a thing of the past. Look at the D Pittsburgh is rolling out. Good luck finding 2 players who aren’t “skating D”. And wow amazing look they’re in the finals. That’s how you win in the modern NHL. Players need to be able to skate the puck out of trouble instead of getting hemmed in their own zone, blocking shots, and icing the puck repeatedly.
I know many of you are going to be tempted to comment and say something like “stats/analytics are stupid they tell us nothing”, so let me address that right now. First of all, stats/analytics are not stupid. They are, in fact, the opposite. They are basically science (which governs our whole world) applied to sports. Second of all, they tell us lots of things that the famed “eye test” cannot tell us. They tell us about shot suppression over long periods of time, which is much more valuable than watching Weber block 3 shots and knock someone down. The problem with statistics vs. “old school” comes when there is a conflict. Stats say that Hedman is a very good defenseman. Old school people and the eye test probably agree that Hedman is a very good defenseman. However, old school people like players such as Weber, Orpik, and Russell, who block shots and “punish” the opposition. Stats people like players such as Karlsson, Klingberg, and Ekman-Larsson, who skate the puck up the ice and keep it 200 feet from their own net. Logic dictates that shooting at the other team’s net is better than blocking an opposing shot. I don’t see how anyone can dispute that claim. So…why do we still glorify physical shutdown D?!
I’d just like to conclude by reiterating that none of what I said today is set in stone. I am only using a FEW methods of analysis out of the many that exist. So, naturally, there is information that is not accounted for in my data. However, I do urge those of you who are not stats-lovers to take a closer look before you dismiss these numbers as “useless statistics”. Statistics like possession and scoring chances are more reliable than “old-school” stats for predicting future performance and success (both individually and team-wise).
I did my best to explain each separate statistic as well I could, because the biggest reason I write these guest posts is to introduce new ideas to the SensChirp community. Many of you Chirpers reading this are familiar with some or all of these statistics, and that’s awesome, but I know not all of you are. For those of you who are scared of numbers, I hope I presented the information in a way that made it easy to follow. For those of you who are interested in statistics, I hope you learned something new. And finally, for those of you who dismiss statistics (and this entire post) out of sheer stubbornness…well, at least I tried.
Of course, like always, comments, criticism, feedback, and general discussion are welcome and encouraged.
Thanks for reading!
Until next time,
KarlssonFan
[Thanks to hockeyanalysis.com and war-on-ice.com for all statistics.]