

Hey SensChirp faithful,
KarlssonFan here, giving everyone some light January reading! First we’re taking a closer look at the basics of possession stats (Corsi) for the still-uninitiated. After that, we’ll examine whether or not Karlsson deserves the Hart and Norris trophies this year (spoiler: he does).
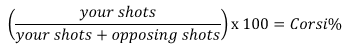
Corsi-for%: Corsi-for% is a stat that tracks shot attempts by both teams and converts it to a percent. Everything in this section is for 5-on-5 play ONLY. The formula works like this:
Let’s say Team A attempts 51 shots towards the opposing net in a game, and team B attempts 49 shots.
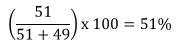
So team A gets 51% of the shot attempts.
Is 51% really that much better than 49%?
For the sake of argument and explaining statistics, let’s assume that over the course of a season (or multiple seasons), every team in the league shoots exactly 10%. Let’s also assume that for every team in the league, exactly half of their shot attempts hit the net (the rest are blocked/miss). Finally, let’s also assume that every game has exactly 100 shot attempts total, so 50 total shots on net. This is obviously unreasonable, but bear with me. So, a team with a 51% Corsi share (Team A) will attempt 51 shots per game out of 100, and 25.5 will find the net. A team with a 49% Corsi share (Team B) will attempt 49, and 24.5 will find the net.
Over 82 games, Team A will attempt 4182 shots (51 x 82), and 2091 will find the net. Team B will attempt 4018 (49 x 82), and 2009 will find the net. At a shooting percent of 10%, Team A will score 209.1 goals at 5-on-5, and Team B will score 200.9 goals at 5-on-5. Of course, the opposite applies; Team A will allow 200.9 goals in the season, and Team B will allow 209.1 goals. So, at the end of the season, Team A has a goal differential of +8.2, and Team B has a goal differential of -8.2.
That 2% Corsi difference between the teams translates to a goal difference of 16.4 between the two teams over the course of the season. There is an extremely strong relationship between goal differential and winning%. Basically: Team A will win more games, period.
These examples seem a bit ridiculous, because not everything works exactly the same for every team, but it shows the basic idea behind Corsi, Fenwick, and other shot-attempt metrics: over time, the more you shoot, the more you hit the net, the more you score, and the more you win. Teams like Toronto and Colorado, recently, have bucked the trend and made the playoffs on unsustainable shooting percentages while getting outshot…but you saw what happened to them the next year.
Now that we have a firm grasp (hopefully) on Corsi, let’s take a look at everyone’s favourite offensive defenseman: Erik Karlsson. The Ottawa Senators have a Corsi-for% of 45.85% so far this season. This is bad (2nd-last in the league). Using the hypothetical scenario from earlier (100 total shot attempts per game, 10% shooting percent), that projects to a goal difference of -34 over 82 games. That is not a long-term recipe for success. In contrast, the LA Kings (58.04% Corsi) project to +66 over 82 games in this scenario.
When Karlsson is on the ice, however, the Sens are actually very good (51.8%), which is good for 8th in the legue, ahead of teams like Chicago, Detroit, St Louis, and Washington. What is most impressive, however, is that fact that his Corsi-Rel is +8.3.
Corsi-Rel: Individual Corsi% relative to team Corsi% when player is off the ice. If a player has an individual Corsi% of 51, and his team has a Corsi% of 49 when the player is off the ice, the player’s Corsi-Rel is +2.
This means that without Karlsson on the ice, the Sens only get 43.5% of the shot attempts (which would be last in the league). If we assume that Ottawa’s shooting% and save% are the same over 82 games with him on and off the ice (let’s use 10% shooting like before), and that there are 50 total 5-on-5 shots in each game…
The team when Karlsson is on the ice:
Shots on goal/game: 25.9
Goals/game: 2.59
Goals against/game: 2.41
Goal difference over season: +15
The team when Karlsson is off the ice:
Shots on goal/game: 21.8
Goals/game: 2.18
Goals against/game: 2.82
Goal difference over season: -53
*Bear in mind that all of the figures that were just discussed, hypothetical or real, are for 5-on-5 play only.
Now, if that doesn’t say #KarlssonforHart, I don’t know what will.
Actually, maybe this will: let’s briefly look at some with or without you (WOWY) numbers. These show the Corsi-for% of individual players when they play with and without Karlsson on the ice. Actually, it’s a waste of my time to type out the players individually, because every single Sens player who has played more than 30 minutes with Karlsson this season has a higher Corsi-for% with him than without him. EVERY SINGLE PLAYER.
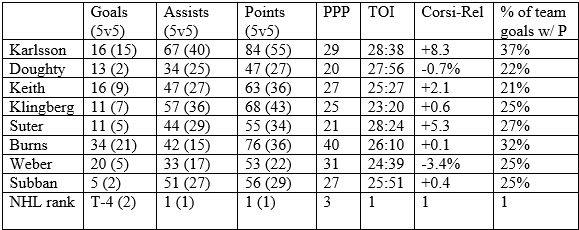
Of course, many people will say “Corsi isn’t everything”, and they’re right. Possession is not the be-all-end-all of hockey statistics. So, let’s look at some more basic ones now, compared to what are IMO the favourites for the Norris this year and the “typical elite D” (all stats are per-game and then extrapolated over 82 games to account for differences in games played, so basically a full season at their current pace; NHL rank is Karlsson’s rank among these 8 D):
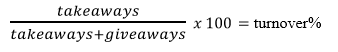
“But Karlsson turns the puck over so often!!!!!!”. The formula for turnover%, which is basically a turnover ratio (40% means 40 takeaways and 60 giveaways per 100 “turnover events”): higher is better
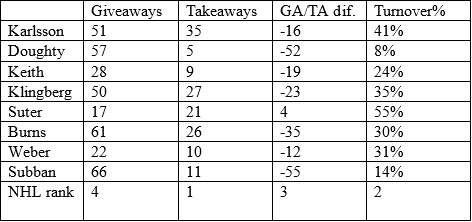
Looking at these two charts, a few names (other than Karlsson) jump off the page for different reasons:
-Burns: 1st in G, 1st in EVG, 2nd in P, 1st in PPP, 2nd in %G w/P
-Suter: 2nd in TOI, 3rd in %G w/P, 1st in giveaways, 1st in GA/TA dif., 1st in turnover%
-Doughty: T-7th in EVG, 7th in A, 6th in EVA, 8th in P, 7th in EVP, 8th in PPP, 8th in CorsiRel, 7th in %G w/P, 6th in giveaways, 8th in takeaways, 7th in GA/TA dif, 8th in turnover%
Klingberg was perhaps the favourite (or at least second to Karlsson) a month or so ago, but his production has faded, his possession stats aren’t great, he has by far the lowest TOI, and plays less than 10s per game short-handed. He would be a close 4th in my rankings at this point.
The top 3 for Norris at this point should probably be Karlsson, Burns, and Suter.
In the 14 total categories listed above:
-Karlsson is 1st in eight categories, not lower than 4th in any category, and not lower than 2nd in any category among my 3 finalists
-Suter has mediocre scoring stats, excellent possession, and excellent GA/TA stats
-Burns has excellent scoring stats (although more than 50% of his production is PP), poor possession, and poor GA/TA stats
I recently saw Yahoo’s “halfway trophy votes” article, and some of the Norris rankings were just hilarious:
- Jen Neale: Doughty (“Give Doughty the Norris already”) Klingberg (“remote second”) Karlsson (“added Karlsson as dictated by the CBA”)
- Josh Cooper: (actually put Karlsson 3rd for Hart) Suter Doughty Weber
Doughty has been having an abysmal season, I don’t understand the Norris love at all…did they look at any stats? Or maybe they watched him give away the puck TEN TIMES as often as he takes it from someone and got confused? No disrespect to Doughty, he’s a phenomenal defenseman in this league…but just not this season. Karlsson, on the other hand, is on pace for the 11th highest era-adjusted points total for defensemen.
Now let’s examine other possible Hart Trophy contenders.
This is a much more difficult one, because we’re comparing forwards, defenseman, and goalies, but I’ll do my best.
For skaters, I’m looking at point production, offensive-zone start%, PDO, Corsi-Relative, the projected total for the second-best point producer on the team, overall team save percentage, and % of goals with a point. For goalies, we’re looking at SV%, even strength SV%, projected wins, team goals per game, Corsi-for%, backup goalie SV%, goals saved above average relative to league, and goalie point shares (number of standings points attributed to goalie’s play).
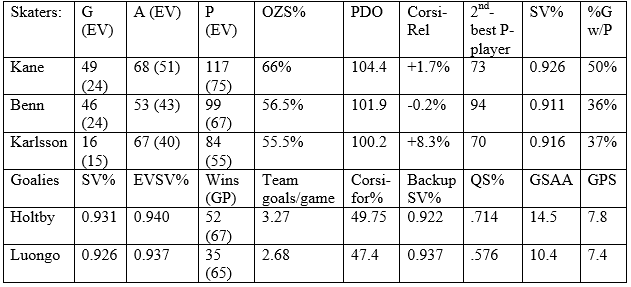
One quality of competition stat that doesn’t fit in the table: Opponent goals for%: basically, how good are the players that these candidates play against:
Kane: 49.5%
Benn: 49.6
Karlsson: 51.4%
Let’s take a quick look at each of the candidates:
Kane:
-leads the league in G, A, P
-very high offensive-zone start%
-2nd best point-player on on pace for 75 points
-point totals boosted by very high (unsustainable) PDO
-has a point on half of his team’s goals
-decent possession player relative to his team
-faces slightly below-average competition
Benn:
-2nd in the league in G, P
-moderate offensive-zone start%
-2nd best point-player on pace for 3rd in league scoring
-point totals boosted slightly by high (but possible sustainable) PDO
-has a point on 36% of his team’s goals
-mediocre possession player relative to team
-faces slightly below-average competition
Karlsson:
-2nd in the league in A, 4th in P
-moderate offensive-zone start%
-2nd best point player on pace for 70 points
-point totals not boosted at all by PDO
-has a point on 37% of his team’s goals
-phenomenal possession player relative to team (best in the league)
-faces above-average competition
Holtby:
-exceptional SV% and EVSV%
-on pace to break record for wins in a season
-plays over 80% of team games
-wins helped by 2nd-ranked offense
-team is mediocre in possession
-backup has above-average save percentage
-over 70% of his starts are “quality starts” (average is 53%)
-has saved 14.5 goals more than league average goaltending
-has contributed an estimated 7.8 standings points
Luongo:
-very high SV% and EVSV%
-on pace for good season in terms of wins
-plays 80% of team games
-wins not helped by offense
-team is poor in possession
-backup has exceptional save percentage
-only 57% of his starts are “quality starts” (average is 53%)
-has saved 10.4 goals more than league average goaltending
-has contributed an estimated 7.4 standings points
Coming into the Hart discussion, I expected Karlsson/Kane/Luongo to be the obvious 3, and Holtby/Benn to be lagging behind. After looking at the stats, though, Luongo/Holtby seems to be a much closer race. Holtby has been helped by a much better team in front of him, but has also been more consistent in his starts (by a fair margin), has better overall save stats, and has saved more goals against than Luongo (relative to league average goaltending). I’d still have to give this edge to Luongo, though, based on the rather poor team he plays for.
For the skaters, it’s really Kane vs. Karlsson here. Benn has the 3rd overall point player and the 3rd defenseman point player on his team, and none of his numbers really compare to Kane or Karlsson. Kane has been more sheltered by his coach (Toews takes the hardest assignments), but is on pace for a whopping 117 points. However, this is fueled by an unsustainable 104.4 PDO, so he may regress and only finish with ~105 points. Karlsson’s PDO is normal, so regression is unlikely; he also has Godly possession stats, turning literally the worst team in the league into a top-10 team singlehandedly, and making every single player he plays with significantly better. Karlsson’s 37% point share is also 3rd all time for a defenseman; the two Bobby Orr seasons that beat him (39% and 43%) won him two Norris’s and a Hart (and a 2nd place finish for the Hart).
Kane’s pace is unsustainable and he has been very sheltered; Luongo has played admirably but he will likely regress (along with his team) and his backup has played even better.
If I was ranking right now, this is what it would look like:
Norris: Karlsson, Suter, Burns
Hart: Karlsson, Kane, Luongo
Thanks for reading everyone, (Thanks to nhl.com, stats.hockeyanalysis.com, TSN.ca, and hockey-reference.com for all statistics.)